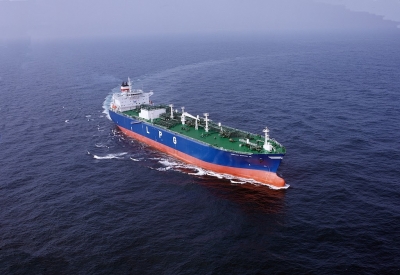
Dorian LPG Ltd., a leading owner and operator of modern very large gas carriers (“VLGCs”), reported its financial results for the three months ended December 31, 2023.
Key Recent Development
- Declared an irregular cash dividend totaling $40.6 million to be paid on or about February 27, 2024.
Highlights for the Third Quarter Fiscal Year 2024
- Revenues of $163.1 million.
- Time Charter Equivalent (“TCE”)(1) rate per operating day for our fleet of $76,337.
- Net income of $100.0 million, or $2.47 earnings per diluted share (“EPS”), and adjusted net income(1) of $106.0 million, or $2.62 adjusted earnings per diluted share (“adjusted EPS”).(1)
- Adjusted EBITDA(1) of $133.0 million.
- Declared and paid an irregular cash dividend totaling $40.6 million in November 2023.
- Entered into the 2023 A&R Debt Facility (amending and restating the 2022 Debt Facility) to upsize the revolving credit facility amount to $50.0 million and added a new, uncommitted accordion term loan facility, in an aggregate principal amount of up to $100.0 million.
- Entered into an agreement for a newbuilding Very Large Gas Carrier / Ammonia Carrier expected to be delivered in the third calendar quarter of 2026 for which we made the first $23.8 million installment payment in January 2024.
John C. Hadjipateras, Chairman, President and Chief Executive Officer of the Company, commented, “We are reporting strong financial results, reflecting an extremely favorable market and great teamwork. The dividend declared last week was our tenth, bringing our cumulative dividend payments to over $463 million. We placed an order to build a new VLGC/AC as we believe in the long-term fundamentals in the LPG market and the potential for ammonia transportation. With the geopolitical environment remaining very challenging, as highlighted by recent hostilities in the Red Sea, we are particularly mindful of the safety of our seafarers.”
Third Quarter Fiscal Year 2024 Results Summary
Net income amounted to $100.0 million, or $2.47 per diluted share, for the three months ended December 31, 2023, compared to $51.3 million, or $1.27 per diluted share, for the three months ended December 31, 2022.
Adjusted net income amounted to $106.0 million, or $2.62 per diluted share, for the three months ended December 31, 2023, compared to adjusted net income of $52.0 million, or $1.29 per diluted share, for the three months ended December 31, 2022. Adjusted net income for the three months ended December 31, 2023 is calculated by adjusting net income for the same period to exclude an unrealized loss on derivative instruments of $6.1 million. Please refer to the reconciliation of net income to adjusted net income, which appears later in this press release.
The $54.0 million increase in adjusted net income for the three months ended December 31, 2023, compared to the three months ended December 31, 2022, is primarily attributable to increases of $59.8 million in revenues, $1.7 million in interest income, and $0.5 in realized gain on derivatives; partially offset by increases of $3.2 million in charter hire expenses, $1.5 in interest and finance costs, $1.4 million in depreciation and amortization, $1.3 million in vessel operating expenses, $0.8 million in general and administrative expenses, and $0.4 million in voyage expenses.
The TCE rate per operating day for our fleet was $76,337 for the three months ended December 31, 2023, a 44.7% increase from $52,768 for the same period in the prior year, driven by higher spot rates and moderately lower bunker prices. Please see footnote 7 to the table in “Financial Information” below for information related to how we calculate TCE. Total fleet utilization (including the utilization of our vessels deployed in the Helios Pool) decreased from 97.8% during the three months ended December 31, 2022 to 93.6% during the three months ended December 31, 2023.
Vessel operating expenses per day increased to $9,936 for the three months ended December 31, 2023 compared to $9,739 in the same period in the prior year. Please see “Vessel Operating Expenses” below for more information.
Revenues
Revenues, which represent net pool revenues—related party, time charters and other revenues, net, were $163.1 million for the three months ended December 31, 2023, an increase of $59.8 million, or 57.8%, from $103.3 million for the three months ended December 31, 2022 primarily due to an increase in average TCE rates and fleet size, partially offset by a reduction of fleet utilization. Average TCE rates increased by $23,569 per operating day from $52,768 for the three months ended December 31, 2022 to $76,337 for the three months ended December 31, 2023, primarily due to higher spot rates and moderately lower bunker prices. The Baltic Exchange Liquid Petroleum Gas Index, an index published daily by the Baltic Exchange for the spot market rate for the benchmark Ras Tanura-Chiba route (expressed as U.S. dollars per metric ton), averaged $132.773 during the three months ended December 31, 2023 compared to an average of $119.106 for the three months ended December 31, 2022. The average price of very low sulfur fuel oil (expressed as U.S. dollars per metric ton) from Singapore and Fujairah decreased slightly from $676 during the three months ended December 31, 2022, to $653 during the three months ended December 31, 2023. Our available days increased from 1,993 for the three months ended December 31, 2022 to 2,272 for the three months ended December 31, 2023 due to three additional vessels in our fleet. Our fleet utilization decreased from 97.8% during the three months ended December 31, 2022 to 93.6% during the three months ended December 31, 2023.
Charter Hire Expenses
Charter hire expenses for the vessels chartered in from third parties were $8.4 million and $5.2 million for the three months ended December 31, 2023 and 2022, respectively. The increase of $3.2 million, or 60.3%, was mainly caused by an increase in the number of chartered-in days from 184 for the three months ended December 31, 2022 to 368 for the three months ended December 31, 2023, offset by certain credits claimed under the terms of the time charters.
Vessel Operating Expenses
Vessel operating expenses were $19.2 million during the three months ended December 31, 2023, or $9,936 per vessel per calendar day, which is calculated by dividing vessel operating expenses by calendar days for the relevant time-period for the technically-managed vessels that were in our fleet. The increase of $1.3 million, or 7.1% from $17.9 million for the three months ended December 31, 2022 was partially due to an increase in operating expenses per vessel per calendar day along with an increase of calendar days for our fleet from 1,840 during the three months ended December 31, 2022 to 1,932 during the three months ended December 31, 2023 days resulting from the delivery of our dual-fuel VLGC Captain Markos in March 2023. The increase of $197 per vessel per calendar day, from $9,739 for the three months ended December 31, 2022 to $9,936 per vessel per calendar day for the three months ended December 31, 2023 was primarily the result of increases of $444 per vessel per calendar day for spares and stores and $120 per vessel per calendar day for repairs and maintenance, partially offset by decreases of $172 per vessel per calendar day for crew wages and related costs and $176 per vessel per calendar day for miscellaneous expenses.
General and Administrative Expenses
General and administrative expenses were $7.7 million for the three months ended December 31, 2023, an increase of $0.8 million, or 10.2%, from $6.9 million for the three months ended December 31, 2022 and was driven by increases of $0.3 million in stock-based compensation, $0.2 million in cash bonuses, and $0.3 million in other general and administrative expenses.
Interest and Finance Costs
Interest and finance costs amounted to $10.1 million for the three months ended December 31, 2023, an increase of $1.5 million, or 16.7%, from $8.6 million for the three months ended December 31, 2022. The increase of $1.5 million during this period was mainly due to increases of $1.0 million in loan interest and a reduction of $0.4 million in capitalized interest. The increase in interest on our long-term debt was driven by an increase in average interest rates due to rising SOFR on our floating-rate long-term debt, partially offset by a decrease in average indebtedness, excluding deferred financing fees, from $645.0 million for the three months ended December 31, 2022 to $633.2 million for the three months ended December 31, 2023. As of December 31, 2023, the outstanding balance of our long-term debt, net of deferred financing fees of $5.6 million, was $618.1 million.
Unrealized Loss on Derivatives
Unrealized loss on derivatives amounted to $6.1 million for the three months ended December 31, 2023, compared to a loss of $0.7 million for the three months ended December 31, 2022. The $5.4 million increase is primarily attributable to changes in forward SOFR yield curves.
Realized Gain on Derivatives
Realized gain on derivatives amounted to $1.9 million for the three months ended December 31, 2023, compared to a realized gain of $1.4 million for the three months ended December 31, 2022. The favorable $0.5 million difference is due to an increase in floating SOFR resulting in the realized gain on our interest rate swaps.